This intrinsic value calculator estimates a stock’s value per share using the revised Benjamin Graham formula. Enter earnings per share, expected earnings growth, a corporate bond yield, and the current share price to calculate an estimated fair value and margin of safety.
The result is a valuation based on your assumptions—not a verified “true price,” a price target, or a guarantee of investment returns.

How to use the intrinsic value calculator
- Enter earnings per share (EPS) in dollars. Use a clearly identified earnings measure, such as trailing-12-month diluted EPS. If unusual gains or losses distort reported earnings, consider a normalized figure and document your adjustments. The earnings per share calculator explains the underlying measure.
- Enter the expected annual earnings growth rate. For 7% growth, enter 7, not 0.07. This should represent a sustainable longer-term earnings growth assumption, traditionally considered over roughly 7–10 years—not simply the latest quarterly growth rate. Historical EPS growth can inform your estimate, but it does not establish future growth.
- Enter the corporate bond yield. For a 4.4% yield, enter 4.4. The revised Graham approach conventionally uses a long-term, high-grade corporate bond yield, often a 20-year AAA yield. Supply an appropriate current figure yourself; the displayed default is not evidence of a live market rate. A bond yield calculation can help explain this input, but an individual bond’s yield may not be a suitable benchmark.
- Enter the current market price per share. This price is used to calculate the margin of safety. It does not change the intrinsic value estimate.
Keep EPS and the share price on the same currency and share basis. For a meaningful application of this model, use positive EPS and a corporate bond yield greater than zero.
The intrinsic value formula
The original Graham relationship estimates value from earnings and expected growth:
V = EPS × (8.5 + 2 × g)
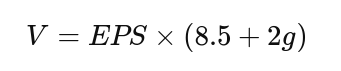
This calculator uses the revised version, which adds a bond-yield adjustment:
V = EPS × (8.5 + 2 × g) × (4.4 ÷ Y)

- V: estimated intrinsic value per share, in dollars.
- EPS: earnings per share, in dollars.
- g: expected annual earnings growth, entered as a percentage number.
- Y: corporate bond yield, also entered as a percentage number.
- 8.5: the formula’s base price-to-earnings multiple for a company with no growth, before the yield adjustment.
- 4.4: the formula’s fixed historical bond-yield reference, representing 4.4%. It is not updated with current interest rates.
Higher EPS or expected growth increases the estimate. A higher bond yield reduces it. These are features of the formula, not proof that the market should assign that value to the stock.
The calculator then measures the stock’s discount to estimated value:
Margin of safety (%) = (V − current market price) ÷ V × 100
Worked example: estimating a stock’s fair value
Suppose a company has EPS of $5, expected annual earnings growth of 7%, a benchmark corporate bond yield of 4.4%, and a current share price of $90.
Intrinsic value = $5 × (8.5 + 2 × 7) × (4.4 ÷ 4.4) = $112.50 per share.
Margin of safety = ($112.50 − $90) ÷ $112.50 × 100 = 20%.
Under these assumptions, the stock trades at a 20% discount to its estimated intrinsic value. Whether that discount adequately compensates you for risk requires further analysis.
How to interpret the margin of safety
When estimated intrinsic value is positive:
- A positive margin of safety means the market price is below the model’s value estimate.
- A zero margin of safety means the price equals the estimate.
- A negative margin of safety means the price exceeds the estimate.
A larger positive margin provides more room for valuation error, but it does not automatically make a stock safer. An overly optimistic earnings forecast can create an apparently attractive discount.
Margin of safety is not potential upside. In the example, the discount is 20% because the denominator is $112.50. A rise from $90 to $112.50 would be a 25% price gain because that calculation uses the $90 purchase price. Neither figure predicts an actual return.
This investing measure also differs from the operating margin of safety used in break-even analysis, which compares sales with break-even sales.
Test assumptions before relying on the result
Rather than using one optimistic forecast, run conservative, base, and optimistic growth scenarios. Keeping EPS at $5, the bond yield at 4.4%, and the market price at $90 gives:
| Illustrative scenario | Annual earnings growth | Intrinsic value per share | Margin of safety |
|---|---|---|---|
| Conservative | 3% | $72.50 | −24.1% |
| Base | 7% | $112.50 | 20.0% |
| Optimistic | 10% | $142.50 | 36.8% |
The same $90 stock appears overpriced in one scenario and discounted in another. Investigate what would support each growth assumption: demand, competition, profit margins, reinvestment needs, and changes in the number of shares outstanding.
You can also translate a chosen margin of safety into a purchase-price threshold:
Maximum price = estimated intrinsic value × (1 − desired margin of safety ÷ 100)
For example, a 30% discount to an estimated value of $112.50 implies a maximum price of $78.75. This is a separate planning calculation, not an additional calculator output or a recommended entry price.

When the Graham formula needs extra caution
- Loss-making or zero-earnings companies: Nonpositive EPS can produce a negative or zero valuation. That is not a meaningful estimate of equity value under this framework. A zero intrinsic value also makes the margin-of-safety calculation undefined.
- Cyclical or unusual earnings: Peak-cycle profits and one-time gains can overstate sustainable EPS. Review earnings across a representative period rather than relying on one unusually strong year.
- Extreme growth or yield assumptions: High growth and very low positive bond yields can generate very large estimates. A zero bond yield makes the valuation formula undefined; a negative yield is not meaningful for this application.
- Important risks outside the formula: Debt, cash conversion, dilution, competitive position, and governance are not separately modeled. The yield adjustment does not replace company-specific risk analysis.
Use this stock intrinsic value calculator as a screening tool, then cross-check the result with cash-flow analysis and comparable-company valuations. The PEG ratio calculator offers another earnings-and-growth comparison, although it also depends on the quality of your growth forecast. Revisit your assumptions when earnings, business conditions, or benchmark yields change.
For investment educators and financial publishers, a customized valuation tool can help readers compare assumptions alongside relevant guidance. Calcopolis lets businesses build customized calculators for their websites, tailored to their audience and valuation methodology.