The FIRE calculator estimates the investment portfolio you need for financial independence and how long it could take to reach it. FIRE stands for Financial Independence, Retire Early: building enough assets to support your spending without relying entirely on employment income.
The calculator projects both saving for retirement and drawing from your portfolio afterward. It accounts for income growth, expenses, investment returns, inflation, applicable capital gains taxes, and extra retirement income. Its results are planning estimates, not a guarantee that you can retire safely.

How to use the FIRE calculator
Start with your current finances, then define the retirement lifestyle you want to fund. Basic and Advanced modes let you work with different levels of detail.
- Enter your annual net income and income growth. Use yearly take-home income, not your gross salary. Income growth represents the annual increase you expect in that income.
- Enter current annual expenses and savings. Include irregular spending, such as insurance premiums and repairs, in your yearly expense total. Current Savings is the existing portfolio you are including in your FIRE plan; avoid counting home equity or other assets you do not expect to use to fund retirement.
- Set your accumulation portfolio. Allocate percentages to stocks, bonds, and cash, then enter an expected annual return for each. The allocations must total 100%.
- Add inflation and capital gains tax assumptions. Inflation increases projected expenses. The capital gains tax input accounts for applicable taxes on investment gains, not a second deduction of income tax from your take-home pay.
- Define retirement spending and extra income. Enter desired annual retirement expenses separately from current expenses. Extra Income can represent earnings, rental income, or other income you expect during retirement. Use amounts realistically available to cover spending, allowing for associated costs and taxes.
- Choose a withdrawal rate and retirement portfolio. Retirement allocations must also total 100%. You can use different allocations and expected returns from those used while saving.
Keep annual and monthly amounts distinct: the spending and income inputs are annual, while retirement cash flow is also shown monthly. Change one assumption at a time to see what drives your result.
The FIRE retirement formula
Your FIRE number is the portfolio needed to cover the portion of retirement spending that other income does not cover. Before inflation and tax adjustments, the calculation is:
Annual funding gap = maximum of 0 and (annual retirement expenses − annual extra income)
Required portfolio = annual funding gap ÷ withdrawal rate
Use the withdrawal rate as a decimal: 4% becomes 0.04. With no extra income, a 4% assumption implies a target of 25 times annual expenses. A 3% assumption implies about 33.3 times expenses.
Worked FIRE number example
Suppose you want to spend $60,000 a year in retirement and expect $12,000 in annual extra income. Your portfolio must cover the remaining $48,000.
| Withdrawal rate | Calculation | Required portfolio before inflation and taxes |
|---|---|---|
| 4% | $48,000 ÷ 0.04 | $1,200,000 |
| 3.5% | $48,000 ÷ 0.035 | About $1,371,429 |
| 3% | $48,000 ÷ 0.03 | $1,600,000 |
These are simplified targets, not complete calculator projections. The full model accounts for inflation and applicable withdrawal taxes, so your projected target may differ. A lower withdrawal rate raises the required portfolio; reliable extra income reduces it.
If extra income fully covers retirement expenses, the formula produces a zero funding gap. That does not eliminate the need for emergency reserves or protection against income ending unexpectedly. When expenses exceed extra income, the withdrawal rate must be positive.
How the calculator estimates time until FIRE
During accumulation, the starting relationships are:
Annual savings = annual net income − annual expenses
Savings rate = annual savings ÷ annual net income × 100
For example, $90,000 in take-home income and $54,000 in expenses leave $36,000 in annual savings—a 40% savings rate. Use the Savings Rate Calculator to examine this measure separately.
The model grows income using your income-growth assumption and expenses using inflation. It adds savings and compounded investment returns to your portfolio, subtracting applicable taxes. The compound interest formula explains why both contributions and time matter.
Expected portfolio returns are weighted by asset allocation. For example, 60% stocks earning 7%, 30% bonds earning 3%, and 10% cash earning 1% produce:
Weighted annual return = (0.60 × 7%) + (0.30 × 3%) + (0.10 × 1%) = 5.2%
Those figures illustrate the calculation, not recommended return assumptions. The calculator uses separate weighted returns for accumulation and retirement, and monthly calculations to find the first month your projected portfolio reaches the required amount.
How to interpret your results
- Required portfolio and time until FIRE: These show your estimated target and when you could reach it under the assumptions entered. A target that is not reached calls for reviewing contributions, spending, income, or assumptions—not simply increasing expected returns.
- FIRE progress: Current portfolio divided by required portfolio, expressed as a percentage. Progress can change when you revise your spending or withdrawal rate, even if your savings stay the same.
- Savings growth chart and accumulation table: Review how much of the projected balance comes from existing capital, new contributions, and investment returns. Check whether income growth actually produces higher savings after inflation.
- Retirement standard of living and cash flow: Compare monthly expenses, extra income, withdrawals, investment returns, taxes, and the remaining portfolio. Reaching the target is only one checkpoint; the projected balance afterward also matters.
- Inflation analysis: Compare nominal balances with inflation-adjusted purchasing power. A larger future dollar balance does not necessarily buy more than a smaller balance today.
For example, at 3% annual inflation, spending of $60,000 today would cost approximately $80,635 in 10 years. Avoid adding inflation twice when interpreting projected expenses or comparing them with your budget.
If expenses exceed income during accumulation, savings are negative and can draw down the portfolio. If income is zero, the usual savings-rate formula is undefined; focus on dollar cash flows instead.
Test a plan that can withstand less favorable assumptions
A useful early retirement calculation should help you identify weaknesses, not just produce an attractive retirement date. Try these comparisons:
- Lower returns or slower income growth: Check whether your plan still progresses without optimistic assumptions. Because the model includes inflation separately, avoid entering inflation-adjusted returns while also applying inflation again.
- Higher retirement expenses: Include healthcare, housing maintenance, travel, taxes, and irregular replacements. Some current costs may disappear, while new ones may arise.
- Less extra income: Test whether you could manage if rental income or part-time earnings fell. A single annual income assumption may not capture benefits or earnings that start later or stop early.
- Different retirement allocations: Compare the effect of changing stocks, bonds, and cash. Lower volatility does not automatically make a portfolio sufficient, and higher expected returns do not make it safer.
- A lower withdrawal rate: This increases the target but reduces the initial draw relative to portfolio size.
A withdrawal rate is not an investment return. The familiar 4% rule is a retirement-planning guideline, not a guaranteed yield or assurance that a portfolio will last. Early retirees may need to fund substantially longer retirements; Vanguard discusses considerations when applying the 4% rule to early retirement.
Assumed returns also do not capture the full effect of market volatility. Poor returns early in retirement, while you are making withdrawals, can be particularly damaging—a risk known as sequence-of-returns risk. Treat the projection as a scenario, not a probability of success.
Tax results are simplified estimates. Actual taxes depend on account type, cost basis, realized gains, jurisdiction, and other income; a capital gains tax input is not a complete retirement tax model.
Choose a savings plan you can maintain
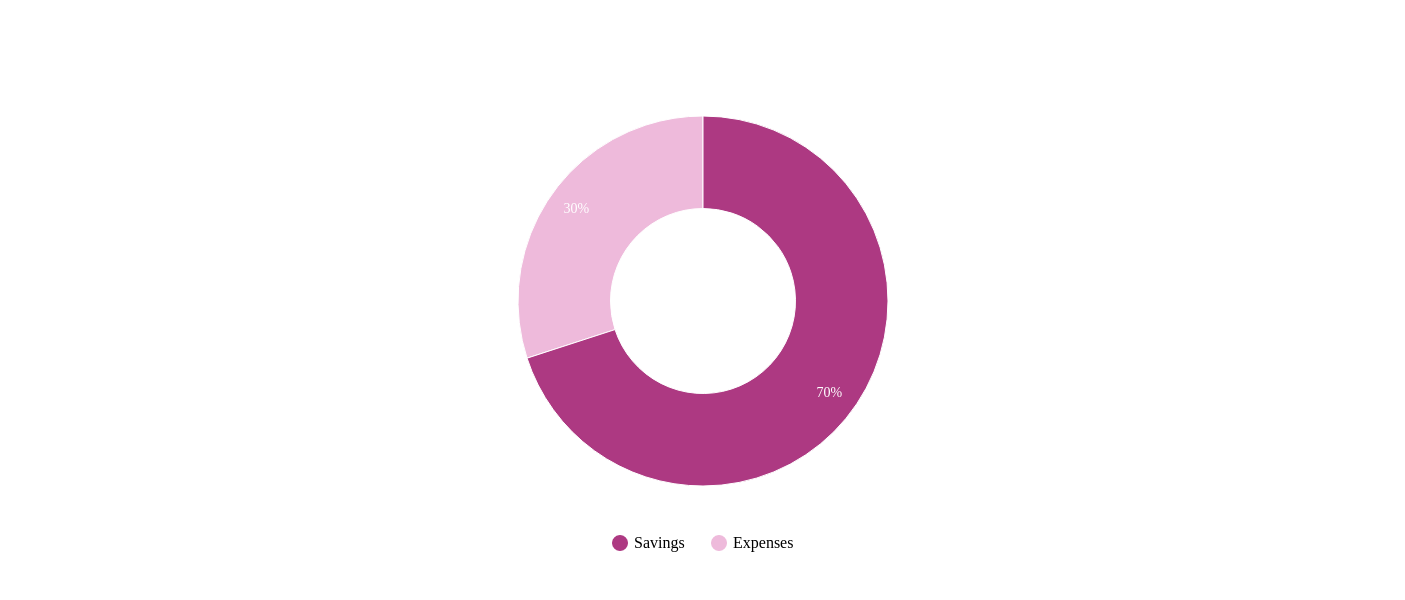
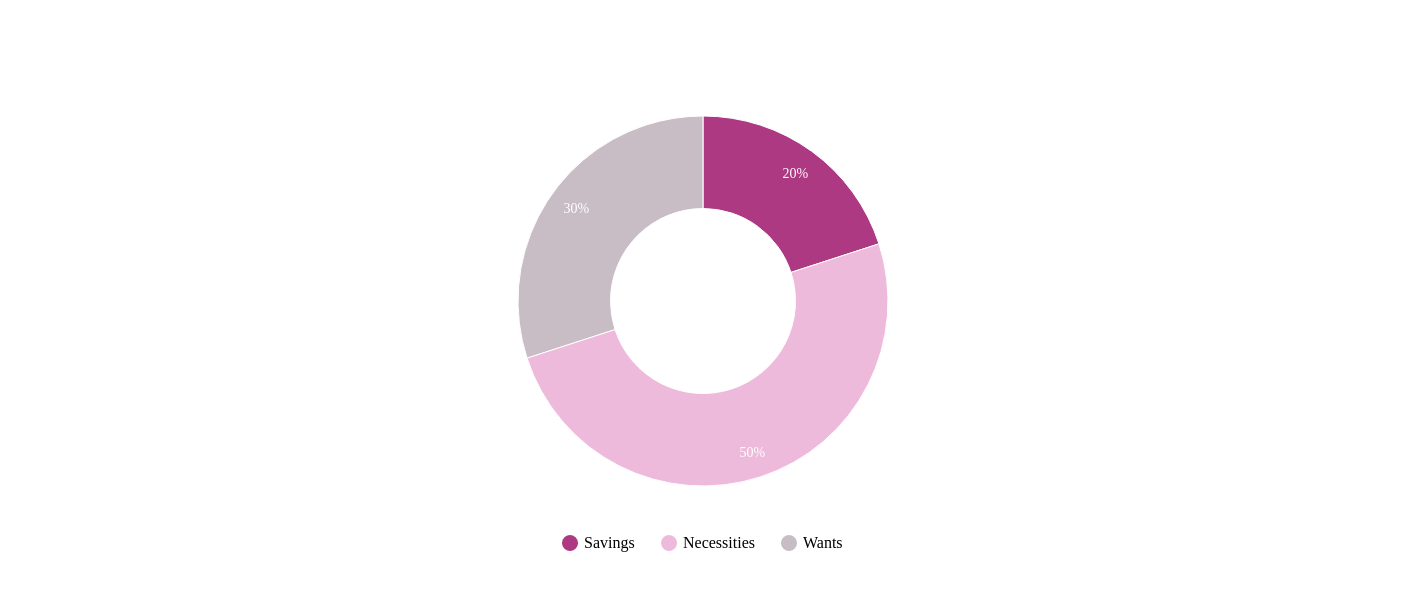
You do not need a particular savings rate to use the calculator. A 70% savings rate leaves 30% of take-home income for spending; it is an aggressive scenario, not a FIRE requirement. For a different budgeting framework, compare the 50/30/20 rule, which allocates 50% to needs, 30% to wants, and 20% to savings and debt repayment.
| Illustration: saving 70% of income | Illustration: the 50/30/20 rule |
|---|---|
 |
 |
Budget allocations do not always equal investment contributions: debt repayments, for example, may improve your finances without adding directly to your retirement portfolio. Keep an accessible cash reserve separate from money committed to long-term retirement funding; the emergency fund calculator can help you estimate that reserve.
For narrower planning questions, use the Retirement Savings Goal Calculator to explore a savings target or the regular savings calculator to examine how recurring contributions could grow.
Offer a tailored savings calculator on your website
Financial educators and planning businesses can use Calcopolis to build a customized savings calculator around their audience’s goals and assumptions, helping visitors estimate a target before requesting a planning consultation.