PEG Ratio Calculator
Find the best stock opportunities with Calcopolis.
Table of Contents
- What is the PEG ratio?
- PEG ratio formula
- How to calculate the PEG ratio?
- What is a good PEG ratio?
- Pros and cons of PEG ratio.
- What to Consider When Comparing the PEG Ratio Across Different Industries?
- Industry Growth Patterns
- Industry Life Cycle
- Capital Intensity
- Market Expectations
- External Factors
- Potential Pitfalls When Relying Solely on the PEG Ratio
- Static Snapshot
- EPS Growth Limitations
- Misinterpretation of Value
- High Growth Misconception
- Ignoring Business Fundamentals
- Similar metrics

Our PEG ratio calculator helps you pick the stocks with the best growth potential by comparing the current company's performance to its growth rate.
In this article, we will discuss how to calculate the PEG ratio and how to interpret the returned values.
Finally, we will analyze how price-to-earnings-growth affects a company's valuation.
What is the PEG ratio?
A PEG ratio is a financial indicator of a company's growth potential. It analyzes the company's stock price, earnings, and growth potential.
PEG analysis extends the simple P/E ratio by considering the company's growth rate, which makes it especially useful in the case of growth stocks.
PEG ratio is widely used among experienced stock investors due to its simplicity and the amount of information it carries.
PEG ratio formula
There are two formulas for calculating the stock PEG ratio.
The first is derived simply from the definition, and its P/E ratio is divided by the company's growth rate.
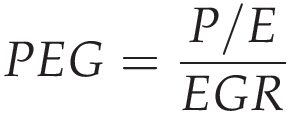
Where:
- P/E - Price to earnings ratio
-
EGR - Earnings growth rate
The second equation is a bit more complex:

Where:
- P/E - Price to earnings ratio
- Retention - the retention rate of your customers
- ROE - Return on equity, more details visit our ROE calculator
How to calculate the PEG ratio?
In order to illustrate the process of calculating the PEG ratio, let's analyze an example of an imaginary company ACME Corp.
The company has emitted 10 million shares, and its total market value is 100 million dollars.
The price per share equals:
Price per share = $100,000,000 / $10,000,000 = $10
The company made $10 million in profit in the last fiscal year, so earnings per share equal:
Earnings per share = Total earnings / Total number of shares = $10,000,000 / 10,000,000 = $1
In this case, the P/E ratio of this company looks as follows:
P/E = Price per share / Earnings per share = $10 / $1 = 10
The company works in a subscription model and has a retention rate of 80%.
The Return on equity (ROE) for the last fiscal year equals 10%.
Now we should put the data into the PEG formula.
PEG = (Price per share/ Earnings per share)/(Retention rate*Earnings growth) = (10 / 1) / 8 = 1.25
Note that a PEG ratio of 1.25 is noticeably lower than the company's P/E ratio.
What is a good PEG ratio?
In theory PEG ratio of 1.0 is considered a balanced correlation between the stock price and the company's earnings.
Values lower than 1 may be considered an investment occasion. Whereas values above 1 are considered overpriced.
Pros and cons of PEG ratio.
Pros. PEG ratio takes into account the company's growth rate.
This is the most significant advantage against a simple P/E comparison. Since the P/E indicator compares price to earnings, it tells nothing about the company's growth and potential.
Rapidly growing companies get noticed by advanced investors, and their price usually reflects that growth. If you analyze just P/E alone, you will miss many good opportunities.
Con. The PEG ratio says nothing about investment risk.
You should never forget that the PEG ratio is just a financial metric, and it tells nothing about the risk assigned to the investment in this company.
What to Consider When Comparing the PEG Ratio Across Different Industries?

The Price Earnings to Growth (PEG) ratio is an indispensable tool for investors seeking to understand a company's valuation in relation to its growth prospects. However, the 'good' and 'bad' values of this ratio can significantly vary when comparing different industries. Here's why:
Industry Growth Patterns
Industries like technology or biotech might naturally have higher growth rates. A slightly higher PEG ratio in these sectors might not necessarily indicate that a stock is overvalued. On the other hand, a utility company or real estate firm might have a slower growth rate, and a lower PEG could indicate an undervalue, while a similar PEG in the tech sector might not.
Industry Life Cycle
Industries in their nascent stages or in rapid growth phases (like renewable energy or AI-driven enterprises) might have a different benchmark for PEG than those in mature or declining phases (like traditional manufacturing).
Capital Intensity
Capital-intensive industries, such as infrastructure or heavy machinery, may have higher amounts of assets and debt, which could affect their earnings and, in turn, influence their Price Earnings to Growth ratios. A stock is undervalued if its PEG ratio is lower than the industry average, but this average can differ vastly between capital-light and capital-intensive sectors.
Market Expectations
Some industries might be subject to market hype. The stock of a cutting-edge tech company might be in vogue, driving up the price and hence affecting the PEG ratio, making it look like the stock is overvalued. Conversely, industries out of favor might have depressed prices, suggesting an undervalue when looking solely at PEG.
External Factors
External pressures such as regulatory changes, geopolitical scenarios, or economic cycles can impact industries differently. For instance, banking and finance might be more sensitive to interest rate changes, which could affect their earnings and consequently, their PEG ratios.
While the PEG ratio is a powerful tool for understanding whether a stock is overvalued or undervalued, it's essential to contextualize this metric within the norms and nuances of the specific industry. Comparing the PEG ratios of stocks across different industries without considering industry-specific factors can lead to misleading interpretations.
Potential Pitfalls When Relying Solely on the PEG Ratio
The Price Earnings to Growth (PEG) ratio is an insightful valuation metric for many investors. It combines the traditional Price-to-Earnings ratio with the expected EPS growth rate, aiming to provide a more comprehensive view of a stock's valuation.
Using an online PEG ratio calculator makes it easy to determine this value. However, while it offers a more nuanced perspective than the P/E ratio alone, relying solely on the PEG ratio for investment decisions can have its drawbacks:
Static Snapshot
The PEG ratio is calculated based on the current stock price and either past or forecasted per-share growth rate. It doesn't necessarily account for dramatic future changes in a company's earnings landscape or external factors influencing its sector.
EPS Growth Limitations
The expected EPS growth rate can vary depending on the source. Different analysts might project different growth rates based on varied assumptions. Over-reliance on overly optimistic or pessimistic future earnings growth estimates can skew the PEG ratio.
Misinterpretation of Value
A lower PEG ratio might indicate undervalued stocks, but it's not a guarantee. Some stocks might have low PEG ratios because of genuine concerns about their future earnings potential or high risks associated with their business model.
High Growth Misconception
Companies with extremely high growth might not sustain that growth indefinitely. If investors don't consider the sustainability of the EPS growth, they might get a distorted view of the stock's true value.
Ignoring Business Fundamentals
Sole reliance on the PEG calculator could lead investors to overlook critical business fundamentals. For example, a company might have significant debt, poor cash flow, or other underlying issues that aren't evident when looking only at the PEG ratio.
While the PEG ratio, especially when calculated using our online PEG ratio calculator, offers a good perspective on stock valuation, it shouldn't be the only metric on which investment decisions are based. You need a comprehensive view, factoring in various metrics and qualitative factors, to make informed and successful investment choices.
Similar metrics
While the PEG ratio provides valuable insights, especially when comparing companies with differing growth rates, investors should consider a holistic approach. This includes:
-
Debt-to-Equity Ratio: Helps understand a company's leverage and financial risk.
-
Price-to-Sales Ratio (P/S): Useful for companies with volatile earnings.
-
Price-to-Book Ratio (P/B): Provides insights into the company's value relative to its book value.
-
Free Cash Flow: Indicates how much cash a company has after expenses - a crucial metric for understanding its financial health.
-
Dividend Yield and Payout Ratio: For investors interested in dividend-paying stocks.
You may be interested in the Present Value of Growth Opportunities, a popular metric for evaluating a company's value. Visit or PVGO calculator for details.
Also, our stock costs basis calculator may help you to track the average cost of purchased stocks. If you are looking for a ways to secure your portfiolio take a look on our hedge ratio calculator.
