The average fixed cost calculator divides your total fixed costs by your output to show how much fixed cost is allocated to each unit. Use it to compare production volumes, estimate unit costs, and assess whether planned sales can support your overhead.

How to use the average fixed cost calculator
- Enter Total Fixed Costs. Add up the fixed costs associated with the product, service, or business you are analyzing. Enter the total dollar amount, not a cost per unit.
- Enter the total quantity. In the field labeled “Total Quanity,” enter the number of units produced during the same period. For a service business, you can use a consistent unit such as completed appointments or serviced customers.
- Read Average Fixed Cost. The result is the fixed cost allocated to one unit, expressed in dollars per unit.
Match the scope and time period. Monthly fixed costs should be divided by monthly output, not annual output. If you enter the costs of one production line, use that line’s output rather than the entire company’s output.
Use a quantity greater than zero. At zero output, average fixed cost is undefined because the calculation would divide by zero, even though the business may still incur fixed costs.
What counts as a fixed cost?
Fixed costs are expenses that do not change with output within a given period and operating range. Examples include facility rent, fixed insurance premiums, equipment leases, and salaried administrative staff.
“Fixed” does not mean permanent. Rent can change when a lease renews, and expanding production may require another facility or supervisor. These changes increase total fixed costs even though costs remain stable within each operating range.

Fixed costs versus variable costs
- Fixed costs: Total costs stay unchanged as output changes within the relevant range. Their cost per unit falls as more units share the same expense.
- Variable costs: Total costs change with activity. Examples include raw materials, per-unit packaging, and sales commissions. Variable cost per unit may remain constant or change with factors such as bulk discounts.
- Mixed costs: Some expenses contain both components. For example, a utility bill may include a fixed service charge plus usage-based charges. Include only its fixed component in this calculator.
If several products share overhead, use a consistent allocation method before calculating a product-specific AFC. Dividing all company fixed costs by the output of just one product would overstate that product’s allocated cost.
Average fixed cost formula
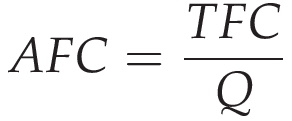
The average fixed cost equation is:
AFC = TFC ÷ Q
- AFC: Average fixed cost, in dollars per unit.
- TFC: Total fixed costs for the period, in dollars.
- Q: Total output for the same period, in units.
The calculator divides the Total Fixed Costs input by the Total Quanity input.
Worked example: $100,000 in fixed costs
Suppose a manufacturer has $100,000 in monthly fixed costs and produces 2,000 units that month:
AFC = $100,000 ÷ 2,000 = $50 per unit
Each unit is allocated $50 of fixed costs. This is not the total cost to make the unit: materials, variable labor, packaging, and other variable expenses must be considered separately.
The table shows how output changes AFC when monthly fixed costs remain $100,000:
| Monthly output | Total fixed costs | Average fixed cost |
|---|---|---|
| 1,000 units | $100,000 | $100 per unit |
| 2,000 units | $100,000 | $50 per unit |
| 4,000 units | $100,000 | $25 per unit |
How to interpret your average fixed cost
A lower AFC means each unit carries a smaller share of fixed costs. It does not necessarily mean total spending has fallen. In the example, doubling output from 2,000 to 4,000 units halves AFC, but the monthly fixed-cost bill remains $100,000.
A higher AFC may reflect low output, unused capacity, higher overhead, or a combination of these factors. There is no universal “good” AFC: the result depends on your product, selling price, variable costs, and capacity.
To assess unit economics, combine average fixed cost with average variable cost:
Average total cost = Average fixed cost + Average variable cost
For example, $50 in AFC plus $35 in variable cost gives an average total cost of $85 per unit. A selling price of $80 would not cover those costs at that output level.
Does increasing output always improve profitability?
No. AFC falls as output rises only while total fixed costs remain unchanged. Expansion can add equipment leases, facilities, or salaried staff, so update your fixed-cost input when capacity changes.
Production is also not the same as sales. Manufacturing more units may reduce fixed cost per unit produced, but unsold inventory does not generate revenue and can create storage and financing costs. Use production quantity for manufacturing unit-cost analysis; if you use units sold for a sales-planning scenario, interpret the result as fixed cost allocated per unit sold.
A lower AFC alone does not establish a higher gross margin or greater accounting profit. Gross margin depends on which costs are included in cost of goods sold, while profit also depends on revenue and all relevant expenses.
Use AFC to plan costs and output

- Compare realistic output scenarios. Calculate AFC at conservative, expected, and high-demand volumes. Check whether each scenario fits your existing capacity.
- Review overhead commitments. Test how a proposed lease, software contract, or staffing change would affect cost per unit at expected output.
- Support pricing decisions. Combine AFC with variable costs and a profit target rather than treating AFC as a minimum selling price.
- Investigate changes over time. If AFC rises, separate the effect of lower output from the effect of higher fixed spending before deciding what to change.
You can also work backward from a target AFC using required quantity = total fixed costs ÷ target AFC. With $100,000 in fixed costs, reaching $40 per unit requires 2,500 units, assuming no additional fixed costs are needed. This is an allocation target, not a break-even calculation.
Related calculators for cost and profit planning
- Use the AVC calculator to calculate variable cost per unit and combine it with AFC for a fuller unit-cost estimate.
- Use the break-even point calculator to examine how selling price, variable costs, and fixed costs determine the sales volume needed to cover costs.
- Use the economic profit calculator to evaluate profitability after considering opportunity costs as well as accounting expenses.
Build a volume-based pricing calculator for your website
If customers request quotes for different order quantities, a customized calculator can combine fixed setup costs, per-unit expenses, and pricing rules to explain how quantity affects a quote. Calcopolis lets businesses build a customized pricing calculator for their website, helping customers explore options before contacting the sales team.