Days Inventory Outstanding Calculator
Unlock Efficiency and Boost Profits: Discover How the DIO Calculator Transforms Your Inventory Management
Table of Contents
- What is Days Inventory Outstanding (DIO)
- Understanding Inventory Management
- How to Calculate Days Inventory Outstanding
- DIO Formula
- Where:
- How to Use the DIO Calculator
- Step-by-Step Guide on Inputting Data into the Calculator
- Understanding the Output and Results
- Case Studies:
- Examples of DIO Calculations in Various Industries
- Analysis of How DIO Impacts Different Business Models
- Interpreting DIO Calculator Results
- Compare Against Industry Benchmarks:
- Trend Analysis:
- Contextual Analysis:
- What is a Good or Bad DIO Score?
- Improving Your DIO Score
- The Impact of Inventory Management Improvements on DIO
- Limitations of Our DIO Calculator
- Conclusion
- FAQ
- What is considered a good DIO score?
- Can DIO vary by industry?
- How can a company improve its DIO?
- How often should a business calculate its DIO?
- Can a very low DIO be a cause for concern?
- Is DIO relevant for small businesses?
- Related Calculators

Understanding fundamental business metrics is essential for success. One such vital metric is Days Inventory Outstanding (DIO). DIO offers a clear glimpse into how effectively a company manages its inventory, a crucial component of operational efficiency and financial health.
What is Days Inventory Outstanding (DIO)
Days Inventory Outstanding, commonly abbreviated as DIO, is a financial ratio that indicates the average time (in days) a company takes to turn its inventory into sales. Essentially, it measures the duration for which a company's capital is tied up in inventory before it is sold. This metric is crucial for understanding inventory management and operational efficiency.
In business management, DIO is a key indicator of inventory efficiency. A lower DIO suggests that a company is able to quickly convert its inventory into sales, indicating efficient inventory management and a healthy cash flow. Conversely, a higher DIO might signal overstocking or challenges in sales, potentially leading to cash flow issues. Financial analysts often use DIO as part of a larger analysis to assess a company's operational effectiveness, liquidity, and overall financial health.
Understanding Inventory Management
Inventory management involves overseeing the flow of goods from manufacturers to warehouses and from these facilities to point of sale. It's a balancing act that ensures optimal inventory levels - enough to meet customer demand but not so much that it ties up excessive capital or leads to waste through unsold stock. Effective inventory management can reduce costs, improve cash flow, and enhance a company's profitability.
DIO plays a pivotal role in inventory management. It provides valuable insights into how long a company holds onto its inventory before selling it. Efficient inventory management aims for a lower DIO, indicating a quick turnaround in inventory and, hence, better utilization of resources. It helps businesses in making informed decisions about production, purchasing, and sales strategies, ultimately aiding in better inventory control.
How to Calculate Days Inventory Outstanding
Days Inventory Outstanding is calculated by dividing the average inventory by the cost of goods sold and then multiplying the result by the number of days in the period. This formula gives businesses a quantifiable measure of how long their inventory remains unsold.
A lower DIO is generally preferable, as it indicates that a company is effective in managing its inventory levels and sales processes. It means that the company is able to sell its inventory quickly, reducing storage costs and improving cash flow. On the other hand, a higher DIO may suggest inefficiencies in the production or sales processes or possibly an indication of obsolete or excess stock.
DIO Formula
The formula for calculating Days Inventory Outstanding is:
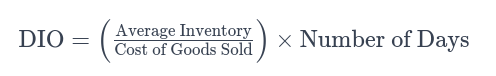
This formula provides a clear picture of how long a company's inventory is held before it's sold.
Where:
- Cost of Goods Sold (COGS): This refers to the direct costs attributable to the production of the goods sold by a company. It includes the cost of the materials and labor used in creating the goods but excludes indirect expenses like distribution costs and sales force costs.
- Average Inventory: This is the mean value of inventory over a certain period of time. It's typically calculated by adding the beginning and ending inventory for a period and dividing by two. This provides a more accurate reflection of inventory levels over time, smoothing out fluctuations that might occur.
In conclusion, understanding Days Inventory Outstanding and its components is fundamental in assessing a company’s inventory management efficiency, which in turn reflects on its overall operational health and financial robustness.
How to Use the DIO Calculator
Step-by-Step Guide on Inputting Data into the Calculator
- Gather Financial Data: Start by collecting your company's financial statements, specifically focusing on the inventory and cost of goods sold (COGS) figures.
- Input Average Inventory: Calculate your average inventory. This is typically done by adding the beginning and ending inventory for a period and dividing by two. Enter this number into the calculator.
- Enter COGS: Input the total cost of goods sold. This information is found in your income statement.
- Specify the Time Frame: Choose the time period over which you want to calculate the DIO, usually a year.
- Calculate and Review: Once all data is inputted, the calculator will provide the DIO figure. Review the result to understand how many days, on average, your inventory is held before being sold.
Understanding the Output and Results
- The DIO result is a numerical value representing the average number of days your inventory is held. A lower number indicates a faster inventory turnover, suggesting efficient inventory management.
Case Studies:

Examples of DIO Calculations in Various Industries
- Retail Sector: Typically sees lower DIO due to faster inventory turnover.
- Manufacturing Industry: May have higher DIO due to longer production and sales cycles.
- Pharmaceuticals: DIO varies greatly depending on the type of products and their demand.
Analysis of How DIO Impacts Different Business Models
Each industry has its benchmarks for a healthy DIO. For instance, fast-moving consumer goods (FMCG) companies generally aim for a lower DIO, while industries with long manufacturing times might naturally have a higher DIO.
Interpreting DIO Calculator Results
Compare Against Industry Benchmarks:
Determine the average DIO for your industry. This can be done through market research, industry reports, or financial databases.
Compare your company's DIO with these benchmarks. Are you above, below, or at par with industry standards?
Understand that industry benchmarks can fluctuate based on economic conditions, technological advancements, and consumer trends.
Trend Analysis:
Look at your company's DIO over multiple periods (e.g., quarterly or annually). Are there patterns or fluctuations?
Investigate what caused these changes. Was it a strategic decision, market conditions, supply chain issues, or changes in consumer demand?
Use this analysis to anticipate future changes in your inventory needs and management strategies.
Contextual Analysis:
Different business models have varying inventory needs. A just-in-time model will naturally have a lower DIO than a bulk manufacturing model.
For businesses with seasonal products, a year-round DIO metric may not be fully representative. Adjust your analysis accordingly.
What is a Good or Bad DIO Score?
Industry-Specific Standards:
A "good" DIO varies across industries. For instance, technology companies might have a lower DIO due to rapid product cycles, while heavy machinery manufacturers may have higher DIOs.
Research industry-specific reports or consult with industry analysts to understand what a competitive DIO score looks like in your sector.
Efficiency vs. Risk Management:
Generally, a lower DIO indicates that a company is efficiently managing its inventory, suggesting quick turnover and good cash flow.
However, a DIO that is too low can imply a risk of stockouts, which can lead to lost sales and dissatisfied customers.
Financial Health Indicators:
A consistently high DIO might point to potential issues like overstocking, obsolescence, or inefficiencies in the sales process.
On the financial side, a high DIO can tie up capital in inventory, affecting liquidity and potentially leading to increased storage costs.
Operational Implications:
Companies should balance maintaining enough inventory to meet demand without overstocking. Efficient inventory management contributes to leaner operations and can positively impact profitability.
Holistic Approach:
It's crucial to interpret DIO in conjunction with other financial metrics like inventory turnover ratio, gross margin, and return on assets to get a comprehensive view of the company's operational effectiveness.
Interpreting DIO calculator results requires not just a numerical comparison but a comprehensive analysis considering industry benchmarks, historical trends, and the broader business context. This approach ensures a more accurate and insightful understanding of a company’s inventory management efficiency and overall financial health.
Improving Your DIO Score

Improving your Days Inventory Outstanding (DIO) score is crucial for enhancing operational efficiency and financial health. Here are comprehensive strategies and their impacts:
-
Optimize Inventory Levels:
- Just-In-Time (JIT) Approach: Implement JIT inventory management to maintain inventory levels closely aligned with real-time demand. This reduces holding times and associated costs.
- Safety Stock Optimization: Calculate the optimal level of safety stock to handle demand fluctuations without overstocking.
- Inventory Segmentation: Categorize inventory based on turnover rates, value, and demand predictability. This helps in applying different strategies for different types of inventory.
-
Enhance Demand Forecasting:
- Leverage Data Analytics: Utilize advanced analytics tools to analyze sales data, market trends, and consumer behavior to predict demand more accurately.
- Collaborative Forecasting: Work closely with sales, marketing, and customers to understand demand drivers and incorporate their insights into forecasting.
-
Streamline Supply Chain:
- Supplier Relationships: Develop strong relationships with suppliers to improve communication and responsiveness. This can lead to quicker restocking and reduced lead times.
- Supply Chain Integration: Use technology to integrate supply chain processes for real-time visibility and coordination, allowing for faster response to changes in demand.
- Lean Inventory Techniques: Adopt lean inventory practices to eliminate waste and inefficiencies in the supply chain.
-
Review and Adjust Pricing Strategies:
- Adjust pricing strategies to stimulate demand for slow-moving items, helping to reduce inventory levels and improve DIO.
-
Implement Inventory Management Software:
- Utilize advanced inventory management systems that offer real-time tracking, automated reordering, and detailed reporting.
-
Regular Inventory Reviews:
- Conduct periodic reviews of inventory to identify and address issues such as obsolete stock, which can inflate DIO.
The Impact of Inventory Management Improvements on DIO
-
Lowered DIO:
- Effective strategies lead to a lower DIO, signaling quicker inventory turnover and efficient use of capital.
-
Enhanced Cash Flow:
- By reducing the time products sit in inventory, businesses can free up cash flow, crucial for operational and financial flexibility.
-
Reduced Storage and Carrying Costs:
- Lower inventory levels translate to lower storage and insurance costs, contributing to better cost management.
-
Improved Customer Satisfaction:
- Efficient inventory management ensures product availability, leading to higher customer satisfaction and loyalty.
-
Better Financial Ratios:
- A lower DIO can positively impact other financial ratios, enhancing the overall financial profile of the business.
-
Strategic Business Advantages:
- An optimized DIO score can provide competitive advantages, such as the ability to adapt to market changes and customer needs quickly.
Improving DIO is a multi-faceted process involving inventory optimization, demand forecasting, supply chain enhancements, and regular reviews. These improvements contribute to the business's long-term success.
Limitations of Our DIO Calculator
The DIO calculator provides a snapshot but doesn't account for seasonal fluctuations or market dynamics.
It's a quantitative tool and doesn't assess the quality of inventory or market demand.
Consider market trends, customer preferences, and economic conditions, which all influence inventory levels and turnover rates.
Conclusion
Days Inventory Outstanding is a crucial metric in understanding and improving a company’s inventory management efficiency. The DIO Calculator serves as a valuable tool in this analysis, offering insights that can guide business strategies and operational improvements. By effectively utilizing the DIO Calculator and interpreting its results correctly, businesses can optimize inventory levels, improve cash flow, and enhance overall operational performance.
Remember, the goal is not just to achieve a good DIO score but to align it with broader business objectives for sustainable growth and profitability.
FAQ
DIO is important because it helps businesses understand how quickly they are converting inventory into sales. It is an indicator of inventory management efficiency, cash flow, and overall operational effectiveness.
What is considered a good DIO score?
A "good" DIO score varies by industry. Generally, a lower DIO indicates more efficient inventory management, but it's important to compare against industry benchmarks.
Can DIO vary by industry?
Yes, DIO can vary significantly across industries due to differences in production cycles, sales processes, and inventory types.
How can a company improve its DIO?
A company can improve its DIO by optimizing inventory levels, improving demand forecasting, streamlining the supply chain, and enhancing inventory turnover strategies.
How often should a business calculate its DIO?
It's advisable to calculate DIO regularly, such as quarterly or annually, to track performance and identify trends over time.
Can a very low DIO be a cause for concern?
Yes, while a lower DIO is generally preferred, an extremely low DIO can indicate potential stockouts or missed sales opportunities.
Is DIO relevant for small businesses?
Yes, DIO is relevant for businesses of all sizes. Understanding and managing inventory efficiently is crucial for maintaining healthy cash flow and operational efficiency, regardless of the business size.
Related Calculators
Calculates how often a business sells and replaces its inventory over a certain period. It's a key measure of inventory efficiency.
Measures the time taken by a company to convert its investments in inventory and other resources into cash flows from sales.
Gross Margin
It helps determine the profitability of the sales by calculating the difference between revenue and the Cost of Goods Sold (COGS).
Calculates how effectively a company is using its assets to generate earnings.
Measures a company's ability to pay short-term obligations or those due within one year.
Similar to the current ratio but provides a more stringent measure of liquidity by excluding inventory from current assets.
Assesses the profitability of a company by revealing how much profit a company generates with the money shareholders have invested.
Gauges the relative proportion of shareholders' equity and debt used to finance a company's assets.
Net Profit Margin Calculator:
Calculates the percentage of revenue that remains as profit after all expenses are deducted.
Determines the optimal order quantity that minimizes the total cost of inventory management, including ordering and holding costs.
Helps businesses determine the point at which total costs and total revenue are equal, i.e., there is no net loss or gain.
Calculates the difference between a company’s current assets and current liabilities, indicating the short-term financial health and operational efficiency.
