Install CalcoPolis as App Add Calcopolis icon to homescreen and gain quick access to all calculators. Click here to see how »
A handy method for evaluating the performance of long-term investments.
Table of Contents
- What is the Compound Annual Growth Rate (CAGR)?
- How to calculate CAGR?
- CAGR formula
- Illustrating CAGR with an Example
- The Impact of Time Horizon on CAGR
- Pros and Cons of CAGR
- Advantages of CAGR
- Limitations of CAGR
- Similar Tools
- CAGR vs. Simple Annual Growth Rate (SAGR)
- CAGR vs. Return on Investment (ROI)
- CAGR vs. Average Rate of Return (ARR)
- CAGR vs. Internal Rate of Return (IRR)
- CAGR vs. Absolute Return
What is the Compound Annual Growth Rate (CAGR)?
The Compound Annual Growth Rate (CAGR) is one of the most practical and widely used metrics in finance. It shows how much an investment grows on average each year — as if it had increased at a steady rate. This makes CAGR perfect for comparing different assets or evaluating long-term performance.
In plain terms, CAGR tells you the “real” yearly return that smooths out short-term ups and downs. As Wikipedia defines it, CAGR represents the geometric progression ratio that provides a constant rate of return over time.
This metric is usually expressed as a percentage, but it can also appear as a ratio. Since not all investments are profitable, CAGR can take both positive and negative values. It’s commonly used by analysts, portfolio managers, and investors to compare performance across stocks, ETFs, mutual funds, real estate, and businesses.
Due to its simplicity and interpretability, CAGR has become a global standard in investment evaluation and financial modeling.
How to calculate CAGR?
To calculate the compound annual growth rate, follow these simple steps:
- Gather your investment data: the starting value, the ending value, and the time period in years.
- Substitute these values into the CAGR formula below.
If you prefer not to calculate manually, use the CAGR calculator above — it instantly computes the growth rate for you.
CAGR formula
The standard formula for calculating CAGR is as follows:
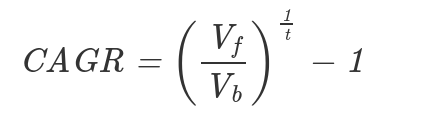
Where:
Vf – value at the end of the investment
Vb – value at the beginning of the investment
t – number of years
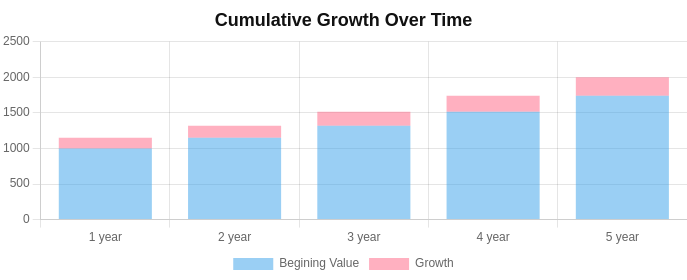
Illustrating CAGR with an Example
Let’s see how CAGR works in practice.
Suppose you invest $1,000 in a promising stock, and after 5 years the investment is worth $2,000.
Total Return Over the Investment Period:
- Initial value: $1,000
- Final value: $2,000
- Total Return = (2,000 − 1,000) / 1,000 = 1 or 100%
This means your investment doubled in value over five years — a total return of 100%.
Step-by-Step CAGR Calculation:
- CAGR = [(Final Value / Initial Value)^(1/Years)] − 1
- Plugging in: [(2,000 / 1,000)^(1/5)] − 1
- CAGR = 2^(1/5) − 1
- CAGR ≈ 14.87%
This shows that your investment grew at an average annual rate of 14.87%.
If you don’t want to use equations, our online calculator above handles it instantly — simply enter your initial value, final value, and number of years.
Interpreting the Result: Although your total return was 100%, CAGR reveals that the investment grew steadily at about 14.87% per year. Financial analysts often consider a CAGR of around 15% an excellent long-term result — though the benchmark varies by asset class and risk level (Russell Investments).
Keep in mind that CAGR represents average growth — it doesn’t reflect year-to-year volatility or market fluctuations.
The Impact of Time Horizon on CAGR
CAGR is strongly affected by the time horizon. The longer the investment period, the lower the annualized growth rate — even if the total profit stays the same. That’s because compounding spreads returns over more years.
Let’s take an example where $1,000 grows to $2,000:
- 5 years: CAGR = 14.87%
- 10 years: CAGR = 7.18%
- 15 years: CAGR = 4.73%
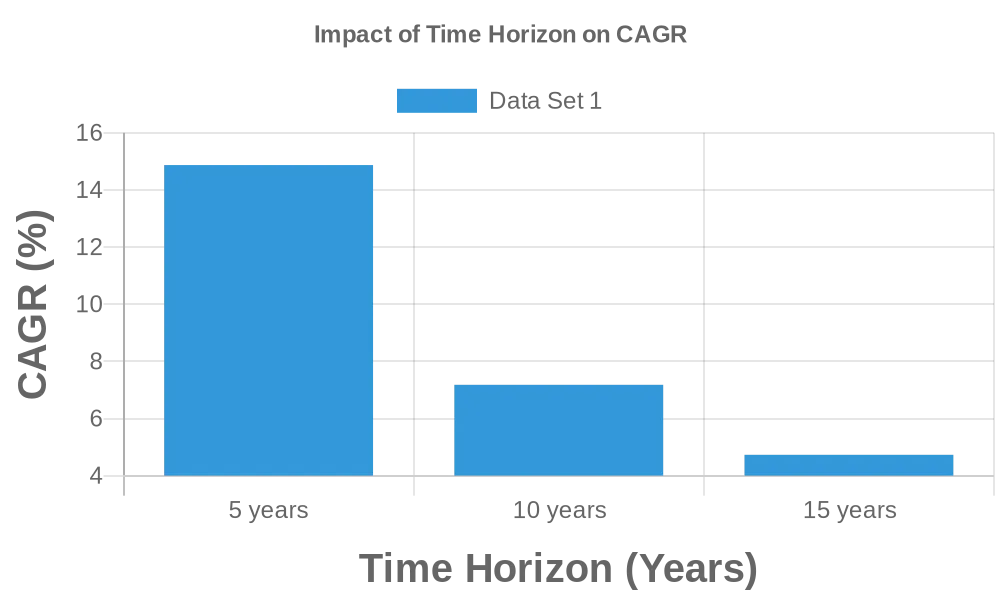
As you can see, the longer the time frame, the smaller the CAGR — even though the total growth remains the same. This underlines the importance of considering both absolute return and duration when assessing investment performance.
Pros and Cons of CAGR
CAGR is one of the most trusted tools in finance, but understanding both its strengths and limitations ensures more accurate interpretations.
Advantages of CAGR
- Simplicity: You only need three inputs — start value, end value, and time. Even new investors can use the CAGR calculator confidently.
- Consistency: Provides a uniform growth measure that allows comparisons across assets, sectors, or time frames.
- Filters Noise: By averaging out volatility, CAGR highlights the long-term trend instead of short-term fluctuations.
- Versatile: Works for annual, quarterly, or monthly periods, making it suitable for any investment type.
- Reliable Benchmark: Professional investors and institutions often use CAGR when reporting portfolio or economic growth rates.
Because it offers a clear, comparable metric, CAGR remains a cornerstone in long-term investment analysis and financial planning.
Limitations of CAGR

- No Volatility Insight: CAGR ignores the ups and downs between the starting and ending points. Two investments may have the same CAGR but completely different risks.
- Assumes Constant Growth: It presumes steady compounding, while real-world returns fluctuate annually.
- Less Useful for Short Terms: Over short periods, temporary market swings can distort results.
- Potentially Misleading: Averaging may hide early losses or late surges in performance.
- Ignores Inflation: CAGR shows nominal growth. For real performance, adjust using inflation metrics — see our Future Value calculator.
- Depends on Accurate Data: Wrong start or end values can lead to misleading CAGR outcomes.
As the CFA Institute explains, CAGR (a geometric mean) can mask volatility relative to arithmetic averages, so pairing it with risk metrics improves interpretation. Source.
Similar Tools
If you’re building or reviewing an investment strategy, Calcopolis provides a full suite of financial calculators to validate your decisions. Explore dozens of tools that help you estimate profitability, future value, or rate of return.
Start with the Investing Calculators section, where you’ll find calculators for ROI, IRR, and more.
CAGR vs. Simple Annual Growth Rate (SAGR)
CAGR: Reflects a compounded, smoothed annual rate of return. SAGR: Calculates the arithmetic average of yearly returns — faster to compute, but less accurate for long periods.
CAGR vs. Return on Investment (ROI)
CAGR: Focuses on the average annualized growth rate over time. ROI (Return on Investment): Measures total percentage gain or loss relative to the initial cost — ideal for single-period evaluations.
CAGR vs. Average Rate of Return (ARR)
CAGR: Emphasizes compounding effects and provides a geometric mean of growth. ARR: Takes a simple arithmetic average, ignoring compounding — suitable for rough comparisons but less precise.
CAGR vs. Internal Rate of Return (IRR)
CAGR: Considers only initial and final values. IRR: Analyzes all cash flows and determines the discount rate at which the net present value (NPV) equals zero. For detailed analysis, see our IRR calculator or XIRR calculator.
CAGR vs. Absolute Return
CAGR: Provides an annualized perspective on growth. Absolute Return: Reflects total percentage change without annualizing — useful for comparing shorter or irregular periods.
Whether you’re a beginner or a seasoned investor, understanding CAGR helps you make better, data-driven financial decisions. Try the calculator above and explore how your investments truly grow over time.
